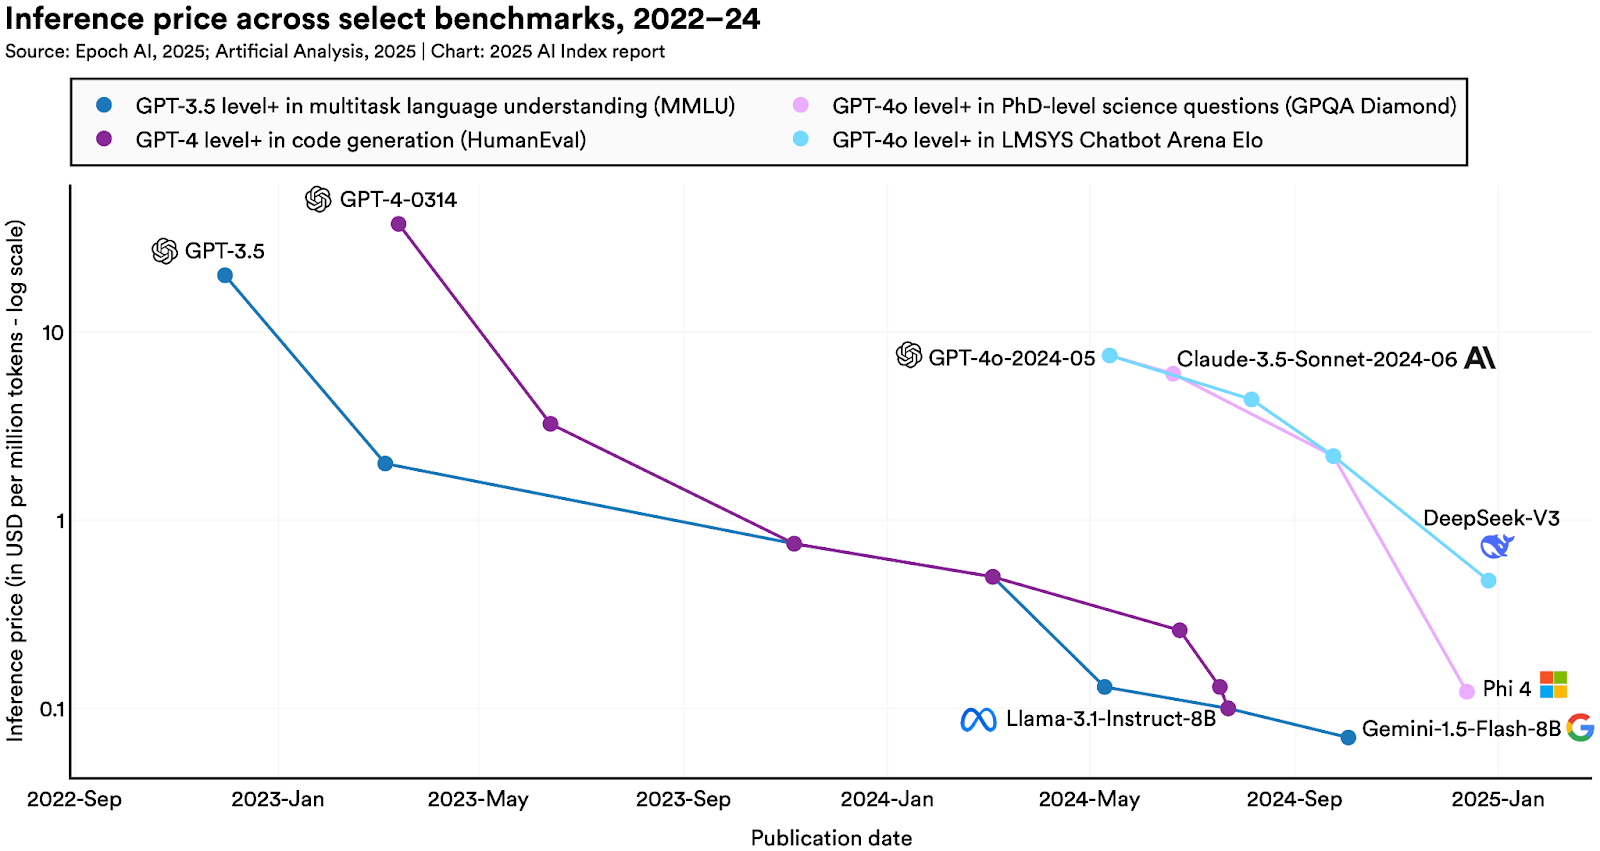
2025 AI Index chart of inference prices across fixed benchmark thresholds; all labels and source credit are retained.
Chart: 2025 AI Index Report; Source: Epoch AI, 2025; Artificial Analysis, 2025 · Original source · View full size ↗
Image provenance & review status
Direct source chart for the article's bounded benchmark-cost comparison.
Source date: 2025-04-07 · Retrieved: 2026-09-16.
Official inline chart with visible source and chart credits retained without alteration. Publication rights: owner review pending.
What happened
Stanford’s Institute for Human-Centered Artificial Intelligence published its 2025 AI Index on April 7. In its ten-chart summary, it compared the cost of querying models that reached a specified Massive Multitask Language Understanding score. For a model at the stated GPT-3.5-equivalent threshold, the reported price moved from $20 per million tokens in November 2022 to $0.07 per million tokens by October 2024, a reduction of more than 280 times. The comparison is a historical benchmark-and-price observation published in 2025. It is not the price of every AI task, and it is not evidence that a lower-priced model matched every capability of the earlier one. [1]
Interpretation
The operational lesson for teams buying AI services is to compare capability at a stated task threshold, rather than putting a generic “AI price” on a strategy slide. Lower token prices may make previously uneconomic high-volume experiments feasible, but integration, evaluation, reliability, latency, privacy controls, and human review can dominate the total cost of a workflow. A benchmark score is a useful common reference only within the limits of that benchmark and the models tested. The Index offers evidence of a strong cost shift in one comparison; it does not prove that a model is fit for a particular customer-support, research, or coding task. That fit still requires local testing. [1]
What to watch
Track the cost of meeting a fixed quality bar on a task-specific evaluation set, with the same prompts and failure definitions across candidate models. Record total workflow cost, including retries and manual correction, alongside list price per token. Watch whether price changes come with changes in throughput limits, context handling, or output quality that matter to users. The 2025 Index release is a dated research event summarizing earlier observations through October 2024; it should not be mislabeled as an April 2025 vendor price quote. Its signal is cheaper access at one measured capability level. The business consequence depends on the actual workload and the quality threshold that workload needs. [1]
Evidence limits
single_source: one opened primary source supports this record; independent outcomes remain unverified.
- One benchmark and selected model prices are not a general workflow cost index.
- No current vendor pricing or task-specific quality was assessed.
Sources & checked claims
- AI Index 2025: State of AI in 10 ChartsStanford HAI · Source date: 2025-04-07 · Retrieved: 2026-09-16
Supports: April 7, 2025 AI Index release MMLU threshold comparison November 2022 and October 2024 model-query prices
Opened Stanford HAI dated summary; checked the model-cost chart text and its explicit benchmark/time window.
- Source publication
- 2025-04-07
- Event date
- 2025-04-07 (announcement-or-report-release)
- Discovered / retrieved
- 2026-09-16
- Prepared
- 2026-09-16
- Site published
- Not established in the source record — draft retained
- Timeline date basis
- source-published
- Rewrite revision
- 1