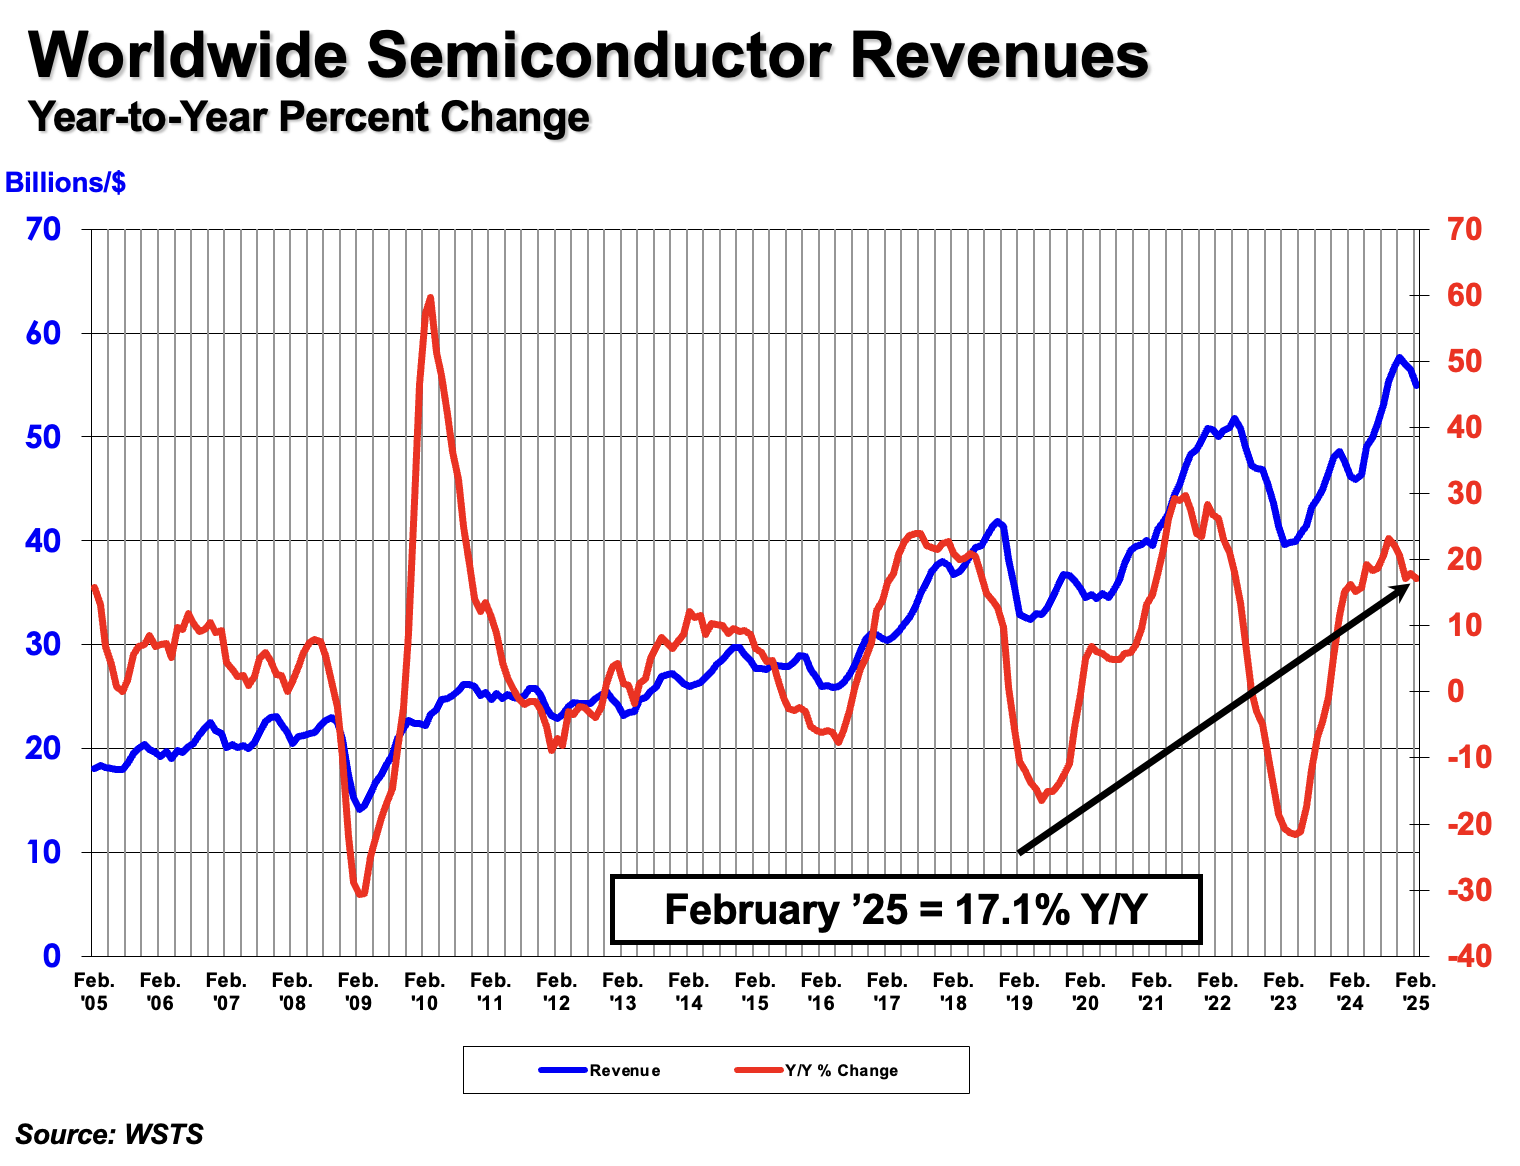
SIA's official WSTS-sourced February 2025 revenue chart, with its axes and source line retained.
Source: WSTS · Original source · View full size ↗
Image provenance & review status
Directly charts the February 2025 sales movement summarized in the article.
Source date: 2025-04-04 · Retrieved: 2026-09-16.
Official inline release chart; visible WSTS source line is retained unchanged. Publication rights: owner review pending.
What happened
On April 4, 2025, the Semiconductor Industry Association released February 2025 global semiconductor sales of $54.9 billion, up 17.1% from February 2024 and down 2.9% from January 2025. It said the underlying World Semiconductor Trade Statistics monthly series is a three-month moving average. The attached February table shows year-over-year growth of 48.4% in the Americas and a decline of 8.1% in Europe, with other listed regions rising. The table also gives the unrounded global total as $54.92 billion. The headline and table are two presentations of the same industry dataset, not independent sales measurements. [1] [2]
Interpretation
For a chip supplier, equipment maker, or purchaser, the global increase is an orientation point, not a forecast for a particular product line. Regional sales are not identical to end-market demand or fabrication location. A moving average also smooths month-to-month changes, which makes a one-month comparison different from a raw shipment count. The operational lesson is to keep the hierarchy of evidence intact: global total, regional split, product mix, order book, and customer inventory each answer different questions. The February release shows that growth can coexist with a monthly decline and a weaker region. It does not identify which companies gained share or whether one application explains the whole increase. [1] [2]
What to watch
Compare later monthly releases with the same WSTS method, and ask whether growth broadens across regions or remains concentrated. Monitor company disclosures on inventory, lead times, and product categories before translating an industry sales series into a capacity decision. If a chart uses the rounded $54.9 billion headline, keep the underlying $54.92 billion table total available for reconciliation. A year-over-year rise says little about the next quarter on its own; neither does a one-month fall establish a downturn. This brief treats the April publication of February data as the historical event and preserves its lag. It offers an operating discipline for reading the data, not investment advice or a company-specific demand forecast. [1] [2]
Evidence limits
SIA release and attached table reconcile rounded and unrounded values; they are the same WSTS-derived dataset, so this is a cross-check, not independent outcome corroboration.
- Industry aggregate is not a product- or company-level demand measure.
- Regional sales and moving averages require careful interpretation.
Sources & checked claims
- Global Semiconductor Sales Increase 17.1% Year-to-Year in FebruarySemiconductor Industry Association · Source date: 2025-04-04 · Retrieved: 2026-09-16
Supports: April 4 publication February $54.9 billion headline 17.1% annual increase and 2.9% monthly decrease WSTS three-month moving-average method
Opened dated SIA release; distinguished data month from publication date.
- February 2025 GSR Table and GraphSemiconductor Industry Association · Source date: not established · Retrieved: 2026-09-16
Supports: unrounded $54.92 billion total regional year-over-year values same dataset breakdown
Opened official two-page PDF. The table names February data but has no established original publication date; recorded null.
- Source publication
- 2025-04-04
- Event date
- 2025-04-04 (announcement-or-report-release)
- Discovered / retrieved
- 2026-09-16
- Prepared
- 2026-09-16
- Site published
- Not established in the source record — draft retained
- Timeline date basis
- source-published
- Rewrite revision
- 1