pewresearch.org · Original source page
Image provenance
Inherited source visual. Image capture date and exact event relationship were not established again in this expansion. Owner publication review pending; credit does not grant permission.
Original assetThe signal
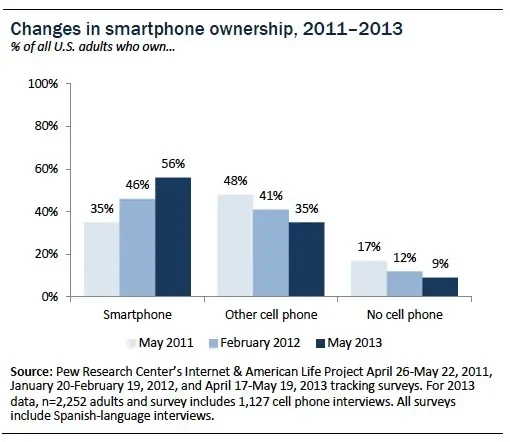
Within Signal Atlas's 17 Creator economy remit, one of the platform economy's foundational shifts crossed a threshold in 2013. The Pew Research Center report published on 5 June 2013 states that 56% of American adults were smartphone owners, and describes this as the first time since Pew's tracking began that a majority of Americans owned one. The figure is a stock measure of ownership at a single point in time, not a monthly count of units sold, and it comes from Pew's own survey research programme rather than a handset maker's shipment count. The report frames the crossing itself, rather than any one quarter's growth rate, as the finding worth recording: a climb through the early 2010s had reached the point where more than half of a national sample reported owning a smartphone.
The evidence
The report breaks its topline down by age, and the gap matters: it states that ownership among adults aged 65 and over grew from 13% in February 2012 to 18% by the time of the June 2013 survey, showing the national majority crossing masked much lower penetration among older cohorts. Pew's continuously updated mobile fact sheet, current as retrieved on 16 September 2026, extends the same ownership series in both directions: 35% in 2011, a range of 51-58% across 2013 estimates, 77% by 2018, and 91% by 2024-2025. That later plateau confirms 2013 sat on a steep part of the adoption curve rather than near its ceiling, and the recurring 2013 range across nearby estimates is more consistent with a genuine crossing than with a single survey's sampling noise.
Timeframe and confidence
This is an editorial reading: a cross-sectional survey produces a point estimate with sampling error, not a certified population count, so 56% describes Pew's sampled adults at one moment rather than a census. Confidence in the broad crossing is nonetheless reasonably high, because the fact sheet's later, independently drawn 2013 estimates cluster in the same 51-58% range rather than diverging from it, and because the demographic breakdown inside the original report is internally consistent with a gradual, uneven adoption pattern rather than an artefact of one poll.
What would change the reading
A contemporaneous 2013 survey from a separate pollster showing ownership clearly below 50% would weaken the majority framing; a later Pew wave reversing course, rather than continuing upward toward the 90% level the 2020s fact sheet eventually shows, would suggest 2013 caught a temporary spike rather than one point on a one-way climb.
- Does a cited adoption figure describe a stock (ownership at a moment) or a flow (units sold in a period)?
- Is a reported majority crossing drawn from a single survey wave, or corroborated by a nearby second estimate?
- Which demographic subgroup sits furthest from a national topline figure, and does that gap change what the claim is useful for?
The 2013 crossing did not itself change consumer behaviour; it documented that a shift already under way had passed the halfway mark, which is why mobile-first platform and advertising strategies followed the milestone rather than preceding it.
Source trail
- Smartphone Ownership 2013www.pewresearch.org · Source publication: 2013-06-05 · Retrieved 2026-09-16
States the 56% majority-ownership topline and the age-group breakdown for the June 2013 survey.
- Mobile Fact Sheetwww.pewresearch.org · Source publication: not established · Retrieved 2026-09-16
Living page giving the longer ownership trend series from 2011 through 2024-2025 for comparison.
- Event date
- 2013-06-05
- First source date
- 2013-06-05
- Source-record publication
- Not supplied — draft retained
- Preparation
- 2026-09-16