one-media.sgp1.cdn.digitaloceanspaces.com · Original source page
Image provenance
Inherited source visual. Image capture date and exact event relationship were not established again in this expansion. Owner publication review pending; credit does not grant permission.
Original assetThe signal
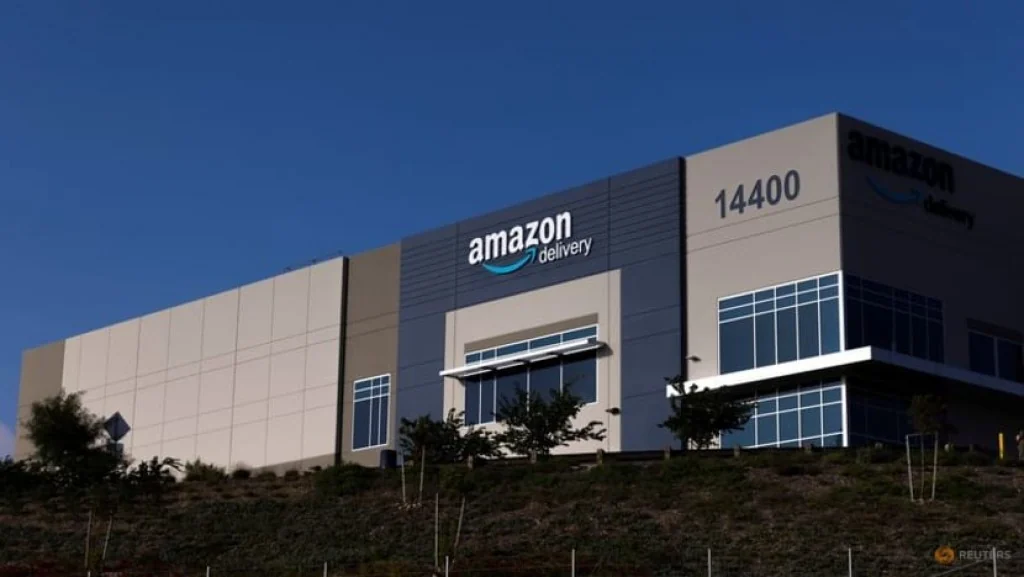
In consumer & society, and specifically retail logistics, few numbers capture a retailer's physical scale like square footage. Amazon's Form 10-K for fiscal year 2021 states that as of 31 December 2021 its fulfilment, data-centre and other facilities totalled 370,392 thousand square feet leased plus 16,663 thousand square feet owned in North America, and 129,035 thousand square feet leased plus 9,601 thousand square feet owned internationally. Two years earlier, the company's 10-K for fiscal year 2019 put the comparable North American figure at 187,148 thousand square feet leased plus 5,591 thousand owned, and international leased space at 76,868 thousand square feet. Summing the fully disclosed figures, Amazon's reported space grew from roughly 270 million square feet at the end of 2019 to roughly 526 million square feet at the end of 2021.
The evidence
The Properties section of a 10-K is a snapshot as of the filing's year-end, not a time series in itself; comparing two separate annual filings, rather than relying on either alone, is what turns two snapshots into a growth measure. A second filing adds the spending side: Amazon's fourth-quarter 2021 earnings release states that full-year 2021 purchases of property and equipment reached $61.053 billion, up from $40.140 billion in 2020, a 52% increase in one year, against full-year net sales of $469.8 billion. Square footage and capital expenditure measure different things, a stock of space and a flow of spending, and both moved in the same direction over the same period, which is stronger evidence of a genuine expansion than either figure alone.
Timeframe and confidence
The square-footage figures are as reported in each year's 10-K and the capital-expenditure figures as reported in the earnings release; confidence in each individual number is high, since all three come directly from SEC filings. This is an editorial reading: two annual snapshots two years apart, plus one year's capital-spending jump, support a reading of rapid expansion across 2020 and 2021 but do not by themselves establish a subsequent pause; this record does not include 2022 or 2023 square-footage or capital-expenditure figures.
What would change the reading
A subsequent 10-K showing 2022 or 2023 square footage flat or declining relative to 2021, alongside capital expenditure below the 2021 level, would support a reading that the buildout paused after 2021. Continued growth at a similar pace would instead suggest 2021 was a step within a longer expansion rather than a peak.
- Did Amazon's fulfilment square footage grow further, plateau, or shrink in 2022 and 2023?
- Did capital expenditure fall back toward the 2020 level, or settle at a new, higher plateau?
- What proportion of the added space was built new versus leased from third parties, and does that change how quickly it could be shed?
The 2019 and 2021 filings, read together with the 2021 spending figures, show a near-doubling of disclosed space alongside a year of sharply higher capital spending; whether that pace continued or reversed is a question for the filings that followed, not this one.
Source trail
- Amazon.com, Inc. Form 10-K for fiscal year 2019www.sec.gov · Source publication: 2020-01-31 · Retrieved 2026-09-16
States fulfilment, data-centre and other space as of 31 December 2019 at 187,148 thousand square feet leased and 5,591 thousand square feet owned in North America, plus 76,868 thousand square feet leased internationally.
- Amazon.com, Inc. Form 10-K for fiscal year 2021www.sec.gov · Source publication: 2022-02-04 · Retrieved 2026-09-16
States fulfilment, data-centre and other space as of 31 December 2021 at 370,392 thousand square feet leased plus 16,663 thousand owned in North America, and 129,035 thousand leased plus 9,601 thousand owned internationally.
- Amazon.com Announces Fourth Quarter Resultswww.sec.gov · Source publication: 2022-02-03 · Retrieved 2026-09-16
States full-year 2021 purchases of property and equipment (capital expenditure) of $61.053 billion, up from $40.140 billion in 2020, alongside full-year net sales of $469.8 billion.
- Event date
- 2022-02-04
- First source date
- 2020-01-31
- Source-record publication
- Not supplied — draft retained
- Preparation
- 2026-09-16