climate.copernicus.eu · Original source page
Image provenance
Inherited source visual. Image capture date and exact event relationship were not established again in this expansion. Owner publication review pending; credit does not grant permission.
Original assetThe signal
The Climate sector's central annual benchmark got its clearest reading yet on 9 January 2024, when the Copernicus Climate Change Service published its Global Climate Highlights for 2023. Using its ERA5 reanalysis dataset, Copernicus reported a global average surface temperature of 14.98°C for 2023, stating this was 0.17°C higher than 2016, the previous warmest year in the record, and that 2023 had "replaced 2016" at the top of that record. Against the 1850-1900 pre-industrial baseline, 2023 measured approximately 1.48°C warmer.
The evidence
A companion release, Copernicus: 2023 is the hottest year on record, also dated 9 January 2024, adds the detail that supports the headline figure rather than repeating it: 2023 was the first year in the record where every single day exceeded 1°C above pre-industrial levels, with roughly half of all days exceeding 1.5°C, and two days in November each surpassing 2°C above pre-industrial levels for the first time on record. July and August 2023 were, together, the warmest two months on record, and boreal summer as a whole ranked the warmest season measured. December 2023 was the warmest December in the dataset, at 13.51°C. The same release records atmospheric carbon dioxide at 419 parts per million and methane at 1,902 parts per billion, both the highest levels in the record it covers.
Timeframe and confidence
Confidence is high: both documents are Copernicus's own dated publications, issued the same day, and their figures are internally consistent rather than contradictory. ERA5's reanalysis draws on multiple observational and modelled inputs blended since 1940 for monthly detail, with the pre-industrial comparison resting on the longer 1850-1900 observational baseline; a reanalysis is not a single thermometer reading but a modelled reconstruction, which is why Copernicus states its results to two decimal places without implying that precision in any one location. The claim this piece treats as established is narrow: 2023 was the warmest calendar year in this specific dataset's record, measured against this specific baseline.
What would change the reading
Copernicus's own subsequent annual highlights, published each following January, would show whether 2023 remained a peak or was itself exceeded, and by how much against the same 1850-1900 baseline. A revision to the ERA5 reanalysis methodology, which Copernicus periodically updates, could also shift the exact anomaly values without changing the year's rank.
- Is a temperature record being compared against the same baseline period as prior records, or has the reference period quietly shifted?
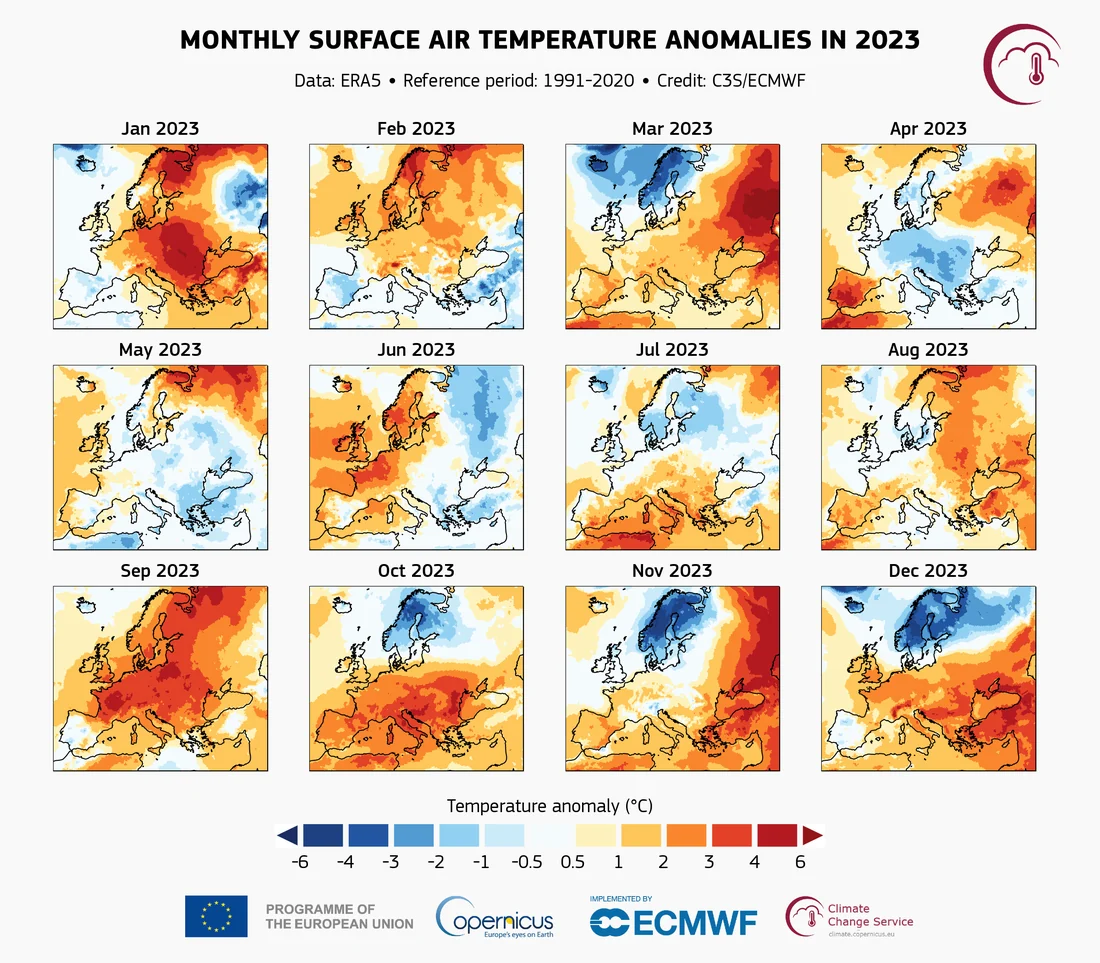
- Does a stated global average obscure sharply different regional or seasonal experiences within the same year?
- How many consecutive records, rather than one, would be needed before a single year's reading is read as a trend rather than a data point?
A single warmest year, however clearly documented, is one point in a series; Copernicus's own dataset is the appropriate place to look for whether it was exceeded again, and this piece does not extend its claim beyond the year it documents.
Source trail
- Global Climate Highlights 2023climate.copernicus.eu · Source publication: 2024-01-09 · Retrieved 2026-09-16
States the 2023 global average temperature of 14.98C, the 0.17C margin over 2016, and the approximately 1.48C anomaly against the 1850-1900 baseline.
- Copernicus: 2023 is the hottest year on recordclimate.copernicus.eu · Source publication: 2024-01-09 · Retrieved 2026-09-16
Details daily, monthly and seasonal records within 2023 and greenhouse gas concentration figures underlying the annual result.
- Event date
- 2023-01-01
- First source date
- 2024-01-09
- Source-record publication
- Not supplied — draft retained
- Preparation
- 2026-09-16