retailmosaic.com.au · Original source page
Image provenance
Inherited source visual. Image capture date and exact event relationship were not established again in this expansion. Owner publication review pending; credit does not grant permission.
Original assetThe signal
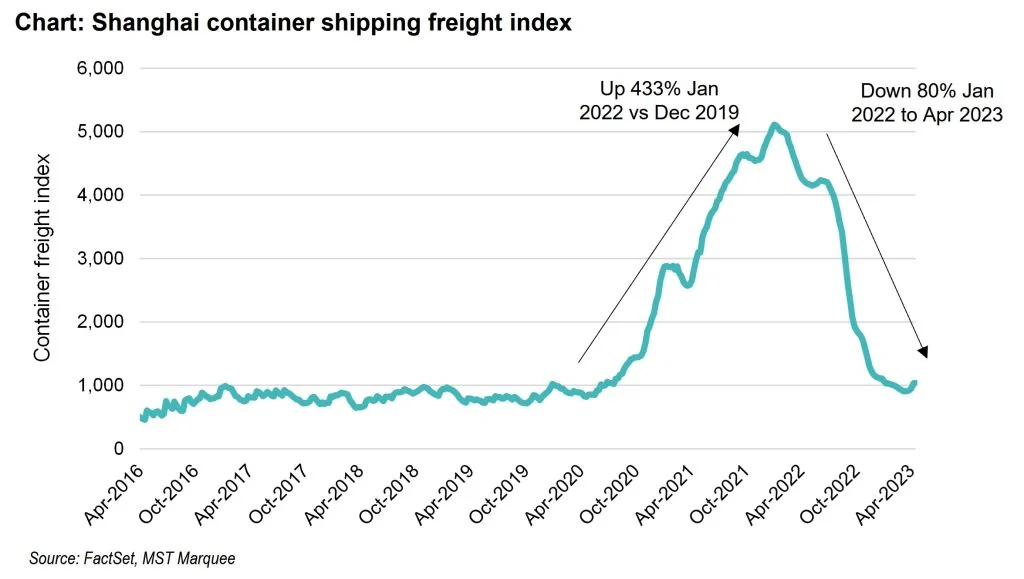
Container freight rates rose sharply during 2021, an industrial-sector supply-chain signal that has since substantially reversed. Drewry's World Container Index, described on Drewry's own site as 'the benchmark widely referenced by procurement teams', is a composite of eight East-West trade lanes, reported in US dollars per 40-foot container. As retrieved on 16 September 2026, the composite stood at $4,476, described as stable 'for the second consecutive week', a level far below the extraordinary readings widely associated with the 2021 surge, though this record does not itself state what that 2021 peak value was.
The evidence
Drewry's own methodology page, current as of its stated 1 January 2025 publication date, sets out how the composite is built: eight lanes between Shanghai, Rotterdam, Genoa, Los Angeles and New York, each assessed up to four times a week from freight forwarders and NVOCCs reporting agreed spot rates, then volume-weighted by each route's share of trade in million TEU annually. A second, independent source corroborates that 2021 was unusual for container rates generally, without confirming Drewry's own figures: the ECB's Economic Bulletin of 23 September 2021 records that the HARPEX index had 'surged above its last peak' from 2005 and 'by the third quarter it had reached a level more than twice as high', citing separately that 'China-U.S. container shipping rates sail past $20,000 to record' on the Shanghai Containerized Freight Index. These are different indices from Drewry's WCI, so their levels are not interchangeable with a WCI figure, but they document the same pattern: a rate spike on Asia-outbound lanes in 2021.
Timeframe and confidence
Confidence that container freight rates rose severalfold on major lanes during 2021 is high, because two independent sources describe the same pattern using different indices. Confidence in Drewry's WCI reaching a specific figure at a specific week in 2021 is not established by the sources opened here; that figure is widely cited elsewhere but was not visible on the live pages retrieved, which show only the current, 2026 reading.
What would change the reading
A dated Drewry press release, or an opened UNCTAD Review of Maritime Transport, with the actual 2021 weekly WCI series would move this from 'a comparable index spiked' to 'the WCI reached this value on this date'. A rate series covering the full decline to 2026 would show whether normalisation was gradual or came in sharp corrections, which matters more for procurement planning than the peak itself.
- How does the current $4,476 composite compare with the pre-2021 baseline, rather than only with the unverified 2021 peak?
- Which of the eight lanes in the composite moved most during the 2021 spike, and did they also normalise fastest?
- Did shippers who signed long-term contracts during the 2021 spike face costs that lagged the index's later decline?
A rate spike is a headline; its decay back toward a stable baseline is the more durable signal for anyone pricing shipping capacity years later. The sources opened here support the shape of that pattern across two independent indices, but not a single verified peak figure for Drewry's own composite.
Source trail
- World Container Index, assessed by Drewrywww.drewry.co.uk · Source publication: not established · Retrieved 2026-09-16
Living index page giving the current composite value and describing the index's role as a procurement benchmark.
- World Container Index methodologywww.drewry.co.uk · Source publication: 2025-01-01 · Retrieved 2026-09-16
Sets out the eight-route composite, the USD-per-40ft-container unit, weekly frequency and volume-weighting method.
- ECB Economic Bulletin, Issue 6 / 2021www.ecb.europa.eu · Source publication: 2021-09-23 · Retrieved 2026-09-16
Documents the 2021 container freight-rate surge via the HARPEX and SCFI indices as a labelled third-source corroboration of the pattern.
- Event date
- No single event
- First source date
- 2021-09-23
- Source-record publication
- Not supplied — draft retained
- Preparation
- 2026-09-16