eia.gov · Original source page
Image provenance
Inherited source visual. Image capture date and exact event relationship were not established again in this expansion. Owner publication review pending; credit does not grant permission.
Original assetThe signal
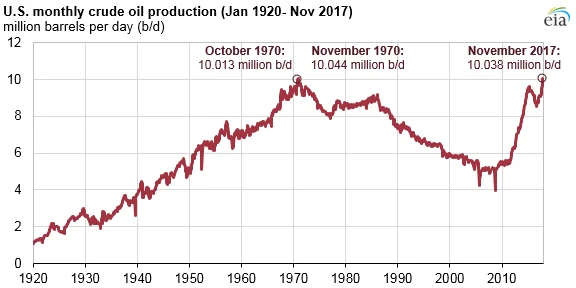
Within Signal Atlas's 05 Energy sector, few series are watched as closely as US crude oil output, and 2018 is where an old benchmark finally gave way. An EIA Today in Energy article published 9 April 2019 reports that annual US crude oil production reached 10.96 million barrels per day (b/d) in 2018, a 17% increase from 2017, and states this growth "surpass[ed] the previous record in 1970." The agency's own historical annual production series puts a number on that older peak: 9,637 thousand b/d in 1970, against a current-vintage 10,972 thousand b/d for 2018 — slightly above the 10.96 million the 2019 article first reported, illustrating the routine gap between a first print and a later-revised figure in the same underlying series.
The evidence
The EIA article attributes the increase to specific regions: Texas averaged 4.4 million b/d in 2018, about 40% of the national total, while its year-on-year increase of almost 950,000 b/d accounted for close to 60% of the national growth — a level share and a growth share, two different numbers. The federal Gulf of Mexico averaged 1.74 million b/d, and Colorado, Oklahoma and North Dakota each added over 95,000 b/d. A separate EIA reference page, retrieved 16 September 2026, dates an earlier point on the same broader story: "on December 18, 2015, the U.S. enacted legislation authorizing the export of U.S. crude oil without a license," ending a decades-old restriction. That precedes the 2018 record by three years; the article reporting the record does not credit the export-policy change as a cause, so the two dates read as sequential markers, not a demonstrated causal chain.
Timeframe and confidence
This is an editorial reading: the production level is drawn from an official statistical agency and corroborated across two parts of its own data infrastructure — a first-print article and the historical table it draws from — so confidence in the level is high. Confidence in any causal story linking the 2015 export-policy change to the 2018 output record is lower, since the EIA's own account of the 2018 increase credits drilling economics and technology, specifically horizontal drilling and hydraulic fracturing, rather than export policy.
What would change the reading
A downward revision to the 2018 annual figure in EIA's historical series that dropped it back below the 1970 level would undercut the record claim; continued upward revision in subsequent years, or a widening gap, would support treating 2018 as a durable break rather than a one-year statistical artefact.
- Is a production "record" claim based on a first-print figure or a since-revised historical series value?
- Does a region's contribution to a national total reflect its share of the level, or its share of the year's growth?
- What is the actual mechanism connecting a cited policy change to an output change, and how many years separate them?
Read narrowly, 2018 is the year US annual crude-output data confirms a near-fifty-year ceiling was breached; read broadly, it is one data point inside a decade-long shale expansion that a single year's headline cannot fully summarise on its own.
Source trail
- U.S. crude oil production grew 17% in 2018, surpassing the previous record in 1970www.eia.gov · Source publication: 2019-04-09 · Retrieved 2026-09-16
States the 2018 annual production level, its 17% growth rate, and the regional breakdown of the increase.
- U.S. Field Production of Crude Oil (Thousand Barrels per Day)www.eia.gov · Source publication: not established · Retrieved 2026-09-16
Gives the current-vintage 1970 and 2018 annual production figures used to size the record.
- EIA table definitions — crude oil exportswww.eia.gov · Source publication: not established · Retrieved 2026-09-16
Living reference page dating the December 2015 repeal of the US crude oil export licensing restriction.
- Event date
- No single event
- First source date
- 2019-04-09
- Source-record publication
- Not supplied — draft retained
- Preparation
- 2026-09-16