eia.gov · Original source page
Image provenance
Inherited source visual. Image capture date and exact event relationship were not established again in this expansion. Owner publication review pending; credit does not grant permission.
Original assetThe signal
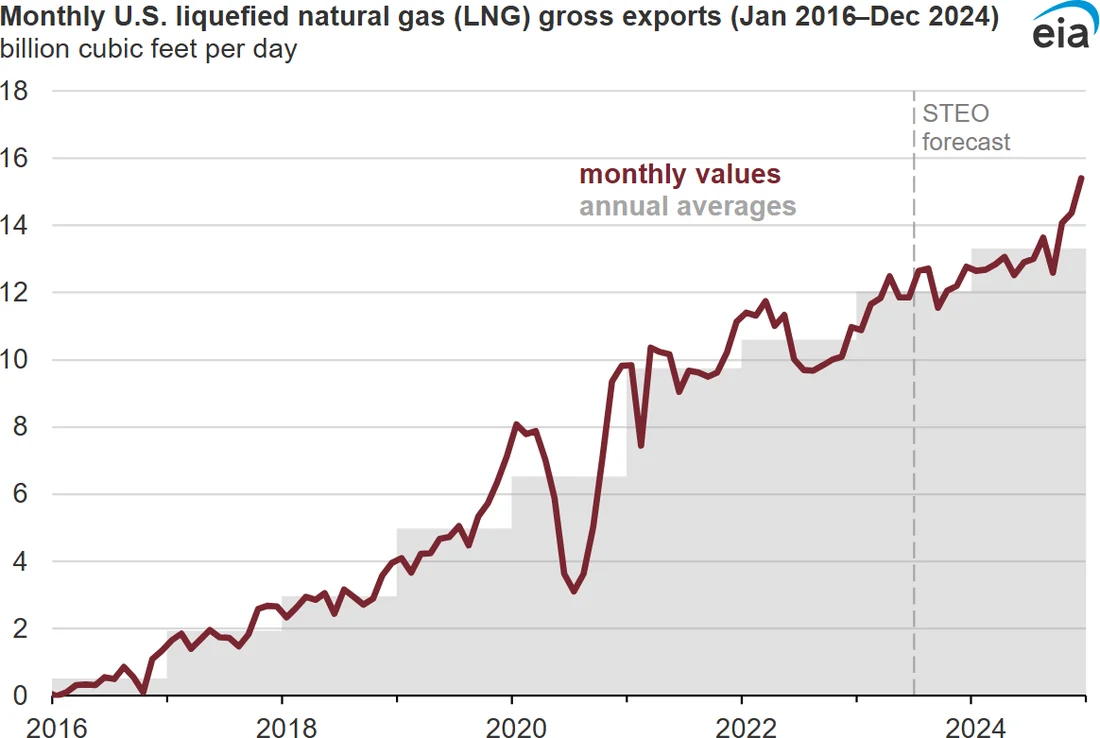
Two related but distinct energy-sector rankings appear in U.S. Energy Information Administration data. First, a level comparison: EIA's article on the first half of 2023 states “the United States exported more liquefied natural gas (LNG) than any other country in the first half of 2023,” at 11.6 billion cubic feet per day (Bcf/d), ahead of Australia's 10.6 Bcf/d and Qatar's 10.4 Bcf/d, a 4% rise on the same period in 2022. Second, a destination-share comparison: EIA's article on full-year 2023 states the U.S. “was again the largest supplier of liquefied natural gas (LNG) to Europe” that year, accounting for 48% of EU and UK LNG imports at 7.1 Bcf/d, up from 44% (6.5 Bcf/d) in 2022 and 27% (2.4 Bcf/d) in 2021.
The evidence
These are two different series and should not be conflated. The first measures a level, total U.S. export volume against named competitor countries, but only for a six-month period; the sources reviewed here do not include a published full-calendar-year 2023 global ranking. The second measures a share, the proportion of a single destination market's imports supplied by one country, for the complete year. A third EIA article covering 2022 adds context for the trend: Europe absorbed 64% (6.8 Bcf/d) of total U.S. LNG exports in 2022, a volume that had grown 141% (4.0 Bcf/d) from 2021, as the continent replaced Russian pipeline gas after the February 2022 invasion of Ukraine by expanding regasification capacity in Germany, the Netherlands, Spain, Italy, Finland and France.
Timeframe and confidence
Confidence in each individual figure is high, since all three come directly from EIA's own published series with stated units and periods. Confidence in a broader claim that “the U.S. was the world's largest LNG exporter in full-year 2023” is lower on the sources opened for this piece, because the only global, multi-country comparison found here covers the first half of the year, not the full twelve months; extending a six-month lead into an annual title is the kind of step this piece avoids taking on its own authority.
What would change the reading
A full-calendar-year 2023 global comparison, opened and cited directly from EIA, an international agency, or trade data, would confirm or complicate whether the first-half lead over Australia and Qatar held for the second half and the year as a whole.
- Did the United States' lead over Australia and Qatar widen, narrow or reverse in the second half of 2023?
- How much of Europe's import growth reflects new regasification capacity versus reduced competition for U.S. cargoes elsewhere?
- Does a share figure (48% of European imports) or a level figure (7.1 Bcf/d) better describe market power in a global commodity?
The documented facts are a first-half global lead and a full-year lead in one destination market; treating the second as proof of the first for the whole year would overstate what these three EIA articles, read together, actually establish.
Source trail
- The United States exported more LNG than any other country in the first half of 2023www.eia.gov · Source publication: 2023-09-12 · Retrieved 2026-09-16
Gives U.S., Australian and Qatari LNG export volumes for H1 2023, establishing the U.S. as the largest exporter for that period.
- Europe was the main destination for U.S. LNG exports in 2022www.eia.gov · Source publication: 2023-03-22 · Retrieved 2026-09-16
Gives Europe's 64% share of total U.S. LNG exports in 2022 and its 141% growth from 2021, providing destination-mix context.
- The United States remained the largest liquefied natural gas supplier to Europe in 2023www.eia.gov · Source publication: 2024-02-29 · Retrieved 2026-09-16
Gives the full-year 2023 U.S. share of European LNG imports (48%, 7.1 Bcf/d) against 2022 and 2021.
- Event date
- No single event
- First source date
- 2023-09-12
- Source-record publication
- Not supplied — draft retained
- Preparation
- 2026-09-16