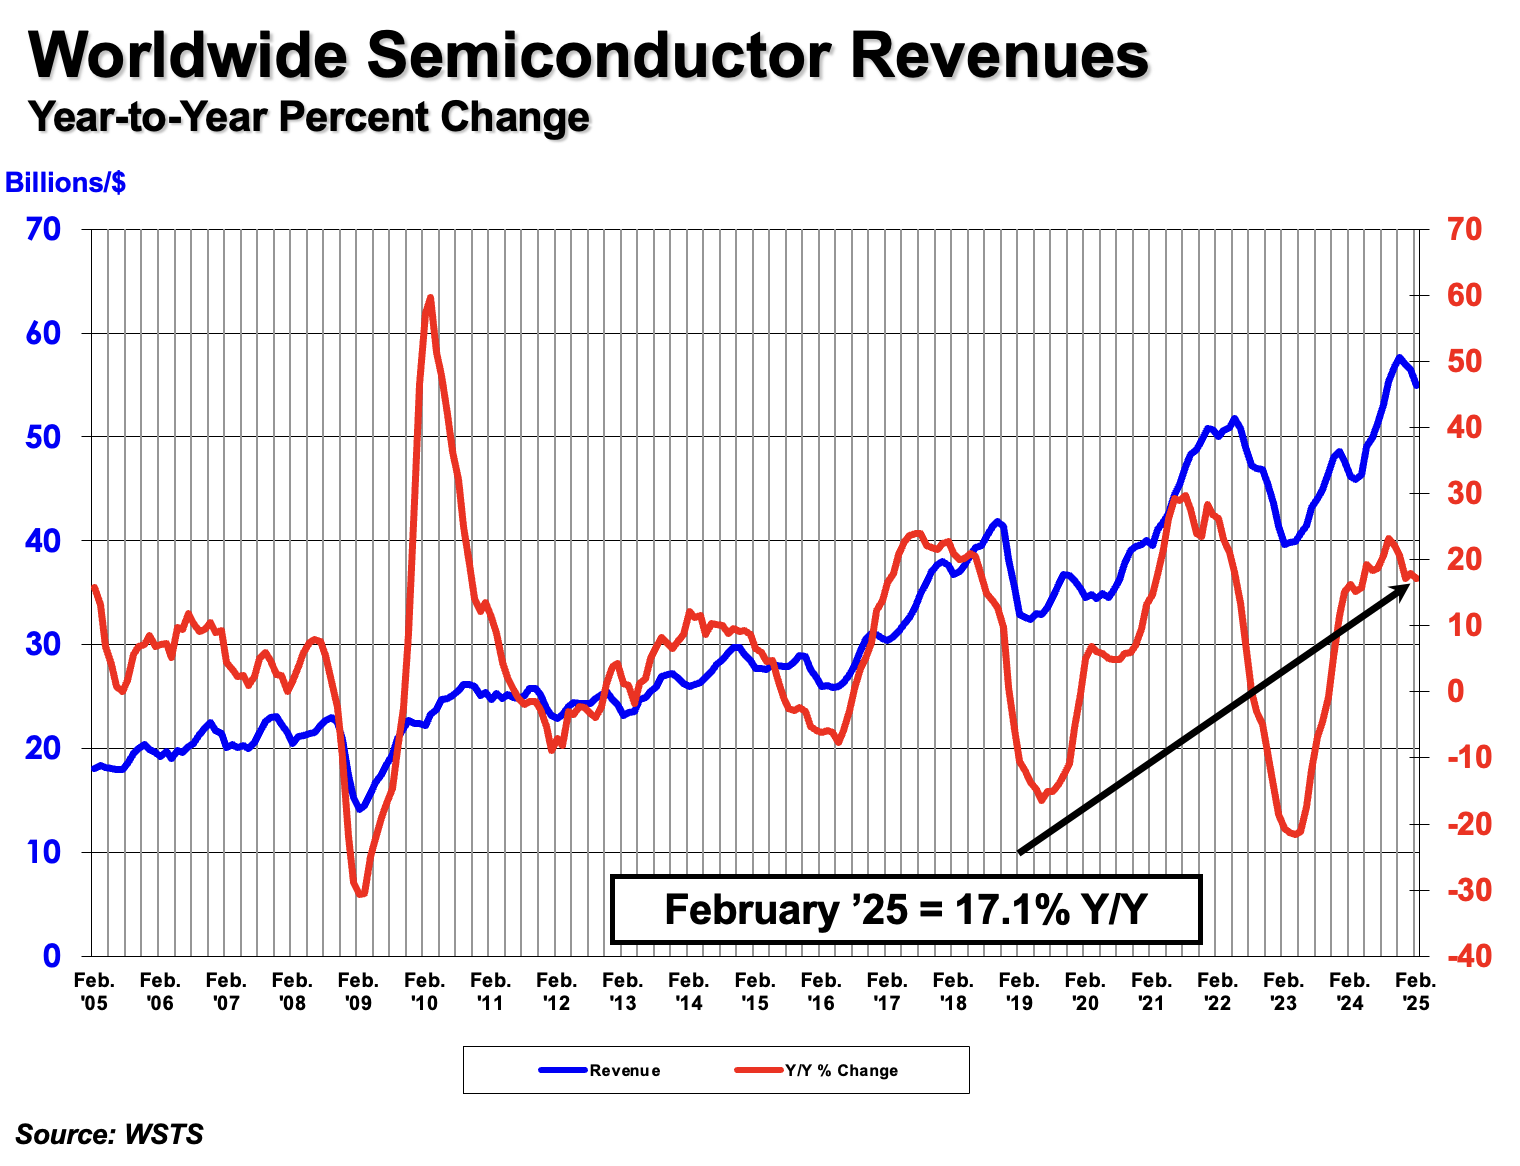
A strong chip-sales headline hid regional divergence
The SIA’s April 2025 release paired global growth with a mixed regional table.
Primary-source checked 2026-09-16 · DraftSeparate reported growth, shifting denominators and addressable demand from a persuasive market narrative.

THE QUESTION
Compare company or segment growth without mistaking purchased revenue, exchange-rate movement or metric changes for operating momentum.
Build a decision-useful market range when published market reports use opaque definitions or incompatible totals.
Prevent incompatible definitions of active, adopted and revenue from becoming a false trend line or market comparison.
These dated examples establish specific events or measurements, not current market-wide conclusions.
6 pieces
The SIA’s April 2025 release paired global growth with a mixed regional table.
Primary-source checked 2026-09-16 · DraftThe 2022 U.S. agriculture census, released in 2024, provides a structural baseline for suppliers.
Primary-source checked 2026-09-16 · DraftApple’s 2023 rollout shows how a payment capability depends on partner apps and merchant onboarding.
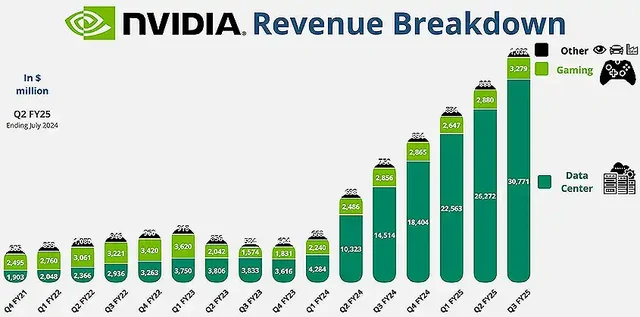
Primary-source checked 2026-09-16 · DraftNvidia's fiscal 2024 10-K reports Data Center revenue of $47.5 billion, 78 percent of total revenue of $60.9 billion.
Inherited collection · Not reverified in this expansionNRF and Appriss Retail state 2023 US merchandise returns at $743 billion, or 14.5% of retail sales, under a revised method.
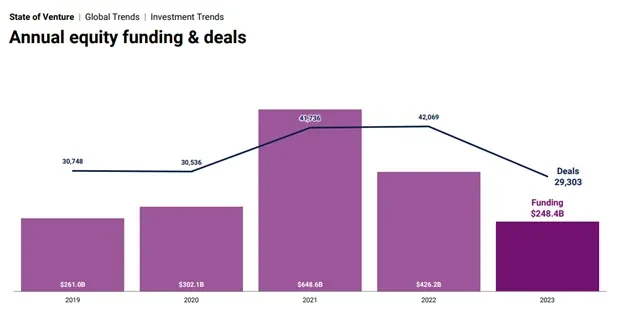
Inherited collection · Not reverified in this expansionThe Q4 2023 PitchBook-NVCA Venture Monitor states 2023 US venture investment ran about $71.6 billion below 2022.
Inherited collection · Not reverified in this expansionNo pieces match. Try another phrase or clear the filters.