sih-st-charts.stocktwits-cdn.com · Original source page
Image provenance
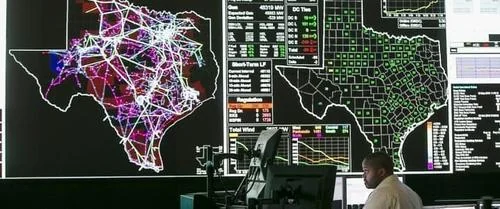
Inherited source visual. Image capture date and exact event relationship were not established again in this expansion. Owner publication review pending; credit does not grant permission.
Original assetThe signal
In the early hours of 15 February 2021, during a severe cold-weather event across Texas and the South Central United States, the electricity grid run by the Electric Reliability Council of Texas (ERCOT), part of the energy sector, came close to a wider collapse. The joint FERC, NERC and Regional Entity staff report, dated November 2021, states that as ERCOT's system frequency fell, operators “had only nine minutes to prevent approximately 17,000 MW of generating units from tripping due to underfrequency relays,” which the report says could potentially have caused a complete blackout of the ERCOT Interconnection. Frequency stayed below the generator-trip level for “over four minutes” before recovering. Firm load shed peaked at 20,000 MW by 7 p.m. that day, the largest controlled load-shed event in U.S. history, lasting nearly three consecutive days.
The evidence
The report draws on outage data from 1,045 individual generating units in the event area, totalling 192,818 MW of nameplate capacity, that experienced 4,124 outages, derates or failures to start between 8 and 20 February. Of the affected units, 58% were natural-gas-fired, 27% wind, 6% coal, 2% solar and under 1% nuclear; 75% of the outages were attributed to freezing issues (44.2%) or fuel-supply issues (31.4%), with natural-gas supply shortfalls causing 87% of the fuel-related outages. A second, independent source, the U.S. Energy Information Administration, measured national natural gas production falling 7% (8.1 Bcf/d) from January to February 2021, the largest monthly decline on record, with Texas production down 15% (4.3 Bcf/d) and falling by more than 10 Bcf/d specifically between 8 and 17 February, the same window the grid report identifies as critical. The two sources corroborate each other on timing and scale, showing the outage was concentrated in gas-fired generation because gas supply itself, not primarily the generating units, failed first.
Timeframe and confidence
Confidence in the chronology and the megawatt and percentage figures is high, since they come from a joint regulatory inquiry with access to grid-operator telemetry, corroborated independently by EIA production data for the same days. A widely cited $80 to $130 billion economic-loss estimate that appears inside the FERC-NERC report is attributed there to a separate Federal Reserve Bank of Dallas analysis, a third-party estimate the report cites rather than one it calculated itself, and should be read with that source clearly labelled.
What would change the reading
Because this event prompted mandatory weatherization standards where none existed before, evidence on whether a comparable future cold snap produces a materially smaller share of gas-related outages would show whether the corrective measures addressed the mechanism this report identifies, rather than only its symptoms.
- Have mandatory weatherization standards since reduced the specific 87% natural-gas-supply share of fuel-related outages?
- Does a future cold-weather event show a materially different fuel mix among affected units than 2021's 58% gas share?
- How much of the Dallas Fed's economic-loss estimate reflects direct outage costs versus broader supply-chain effects?
The nine-minute margin is the sharpest fact in the report: it converts a familiar description, “the grid nearly failed,” into a measured distance from a specific, documented technical threshold.
Source trail
- The February 2021 Cold Weather Outages in Texas and the South Central United States (FERC, NERC and Regional Entity Staff Report)www.ferc.gov · Source publication: 2021-11-01 · Retrieved 2026-09-16
Documents the fuel mix and causes of generation outages, the ERCOT frequency near-collapse, and firm load-shed figures.
- February 2021 weather triggers largest monthly decline in U.S. natural gas productionwww.eia.gov · Source publication: 2021-05-10 · Retrieved 2026-09-16
Independently measures the February 2021 natural gas production decline nationally and in Texas that fed the outages.
- Event date
- 2021-02-15
- First source date
- 2021-11-01
- Source-record publication
- Not supplied — draft retained
- Preparation
- 2026-09-16