gvegayon.github.io · Original source page
Image provenance
Inherited source visual. Image capture date and exact event relationship were not established again in this expansion. Owner publication review pending; credit does not grant permission.
Original assetThe signal
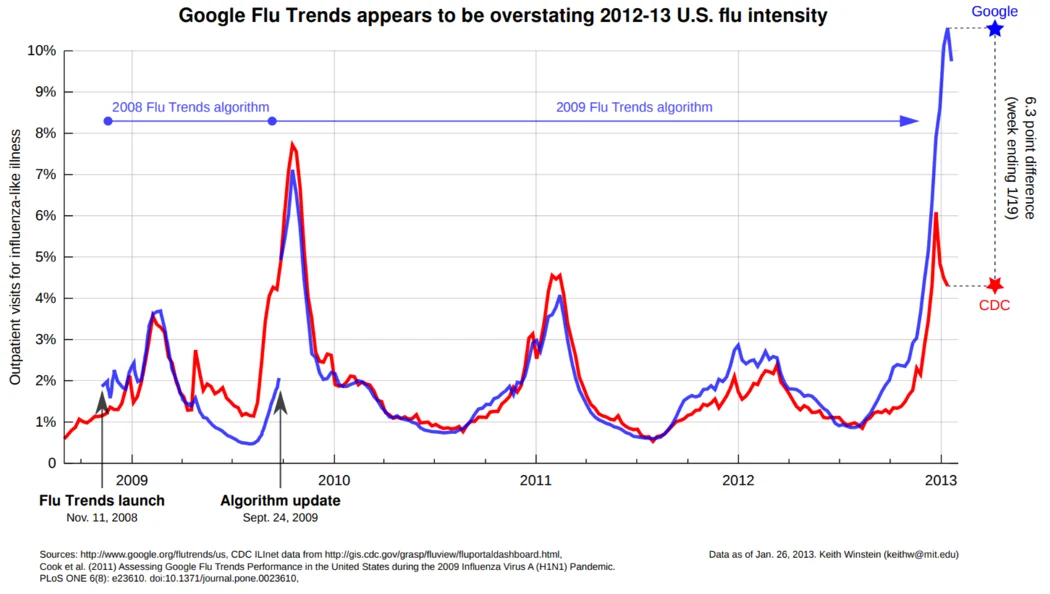
This method entry, filed to Signal Atlas's cross-sector desk, is about what happens when a proxy signal is not checked against a ground truth. On 14 March 2014, the journal Science published a policy-forum paper by David Lazer, Ryan Kennedy, Gary King and Alessandro Vespignani, "The Parable of Google Flu: Traps in Big Data Analysis," examining Google Flu Trends (GFT), a tool that estimated influenza-like illness (ILI) from search-term volume and had been presented as an early, celebrated use of search data as a public-health signal.
The evidence
The paper's finding is specific and dated: checked against the Centers for Disease Control and Prevention's own surveillance, GFT "reported overly high flu prevalence 100 out of 108 weeks" from 21 August 2011 to 1 September 2013, and had overshot the actual 2011-2012 season level "by more than 50%." The CDC's own account of how it measures influenza activity describes the ground truth GFT was checked against: roughly 4,000 outpatient providers reporting patient visits for a defined illness, plus laboratory-confirmed results from around 400 public health and clinical laboratories. The paper attributes GFT's drift to two mechanisms: "big data hubris," the initial method's fit of 50 million search terms to only 1,152 known data points, an approach prone to overfitting, and "algorithm dynamics," ongoing changes to Google's own search results and suggested searches that altered the very search behaviour GFT's model depended on.
Timeframe and confidence
This is a peer-reviewed comparison against a named, independently collected surveillance series, covering a stated 108-week window, a strong basis for the specific finding: for that period, GFT missed high, and by a stated size. The paper's own reported mean absolute error figures, 0.486 for GFT against 0.311 for a simple model using lagged CDC data, back the finding with a stated statistical measure rather than description alone.
What would change the reading
A comparable check of a newer proxy signal, whether built on search data or another behavioural trace, against its own named ground truth over a stated multi-year window would show whether the lesson, that an unmonitored proxy can drift for years before the drift is reported, has been addressed rather than repeated.
- Does this proxy signal have a named ground-truth series it is checked against, on a stated schedule?
- Has the underlying platform or process generating the proxy changed since the signal was built?
- How many data points was the original model fitted to, relative to the number of inputs it considered?
A proxy is only as good as its last check against a ground truth. Google Flu Trends drifted for roughly two years before that check was widely reported, and the paper's dated, quantified comparison is what turned a headline into a documented case.
Source trail
- The Parable of Google Flu: Traps in Big Data Analysisgking.harvard.edu · Source publication: 2014-03-14 · Retrieved 2026-09-16
States the 100-of-108-week overestimate, the more-than-50% overshoot, the mean absolute error figures, and the overfitting and algorithm-dynamics causes.
- U.S. Influenza Surveillance: Purpose and Methodswww.cdc.gov · Source publication: not established · Retrieved 2026-09-16
Describes the ILINet outpatient network and laboratory surveillance that served as the ground truth GFT was checked against.
- Event date
- 2014-03-14
- First source date
- 2014-03-14
- Source-record publication
- Not supplied — draft retained
- Preparation
- 2026-09-16