betterpitch.s3.amazonaws.com · Original source page
Image provenance
Inherited source visual. Image capture date and exact event relationship were not established again in this expansion. Owner publication review pending; credit does not grant permission.
Original assetThe signal
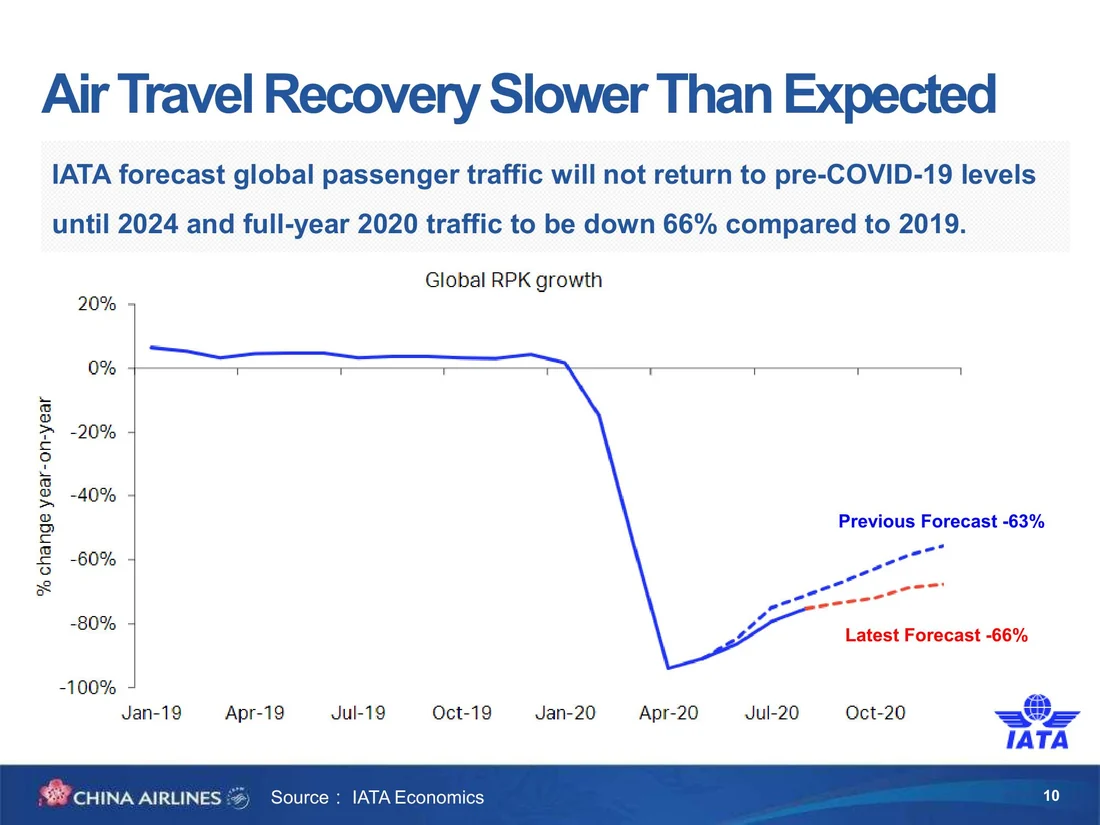
IATA, the airline industry's global trade association within the travel sector, reported on 31 January 2024 that full-year 2023 global air travel demand, measured in revenue passenger kilometres (RPK), rose 36.9% on 2022 and reached 94.1% of pre-pandemic 2019 levels. International traffic rose 41.6% to reach 88.6% of 2019 levels, while domestic traffic rose 30.4% and had already exceeded 2019 levels by 3.9%.
The evidence
Revenue passenger kilometres multiply the number of paying passengers by the distance flown, a measure of travel volume rather than of flights, seats, or airline revenue, and IATA compiles it from data its member airlines report. The domestic-international split matters here: domestic markets, unconstrained by cross-border rules, visa requirements or bilateral air-service agreements, recovered faster and had already overtaken 2019, while international travel, still catching up, remained 11.4 percentage points short. The release names Australia and Japan as the only major domestic markets still below pre-pandemic demand, and records Asia-Pacific international traffic up 126.1% year-on-year off a low base, with China's domestic market 7.1% above its own 2019 level. A separate measure covering the same period, UN Tourism's World Tourism Barometer, cites an IATA tracker showing air capacity and passenger demand at only 87% of 2019 levels through October 2023, a partial-year snapshot that undercounts the stronger finish IATA's completed full-year figure of 94.1% captures; the difference is a first-print-versus-final-count problem, not a contradiction between the two organisations.
Timeframe and confidence
IATA's release is a dated, member-sourced industry statistic covering the full calendar year, comparing consistently against a fixed 2019 baseline throughout. This is editorial reading: an industry association's own traffic count is a strong primary source for the volume of paid travel its members carried, though it does not itself measure fares, profitability, or whether growth came from pent-up demand, capacity additions, or price changes.
What would change the reading
IATA's subsequent full-year releases showing whether international traffic closed its remaining gap to 2019, or whether growth rates slowed once pent-up post-pandemic demand was exhausted, would show whether 2023 was a recovery plateau or a step on a longer growth path.
- Did international RPK close its remaining gap to 2019 levels in the following year?
- Did growth rates slow once pent-up demand from the pandemic period was exhausted?
- Did fares and airline profitability move in the same direction as passenger volume, or independently of it?
A full-year, member-sourced traffic count is solid evidence of how much flying happened in 2023, but volume recovering is a different claim from the industry's underlying economics recovering, and this release measures only the former.
Source trail
- Global Air Travel Demand Continued Its Bounce Back in 2023www.iata.org · Source publication: 2024-01-31 · Retrieved 2026-09-16
IATA's own release states full-year 2023 revenue-passenger-kilometre growth and recovery against 2019, split by domestic and international traffic.
- UNWTO World Tourism Barometer, Volume 22, Issue 1, January 2024 (Excerpt)www.tourismticker.com · Source publication: 2024-01-18 · Retrieved 2026-09-16
Cites a separate IATA tracker figure for partial-year 2023 air travel recovery, useful for showing how a provisional in-year reading differs from IATA's own completed full-year total.
- Event date
- 2024-01-31
- First source date
- 2024-01-18
- Source-record publication
- Not supplied — draft retained
- Preparation
- 2026-09-16