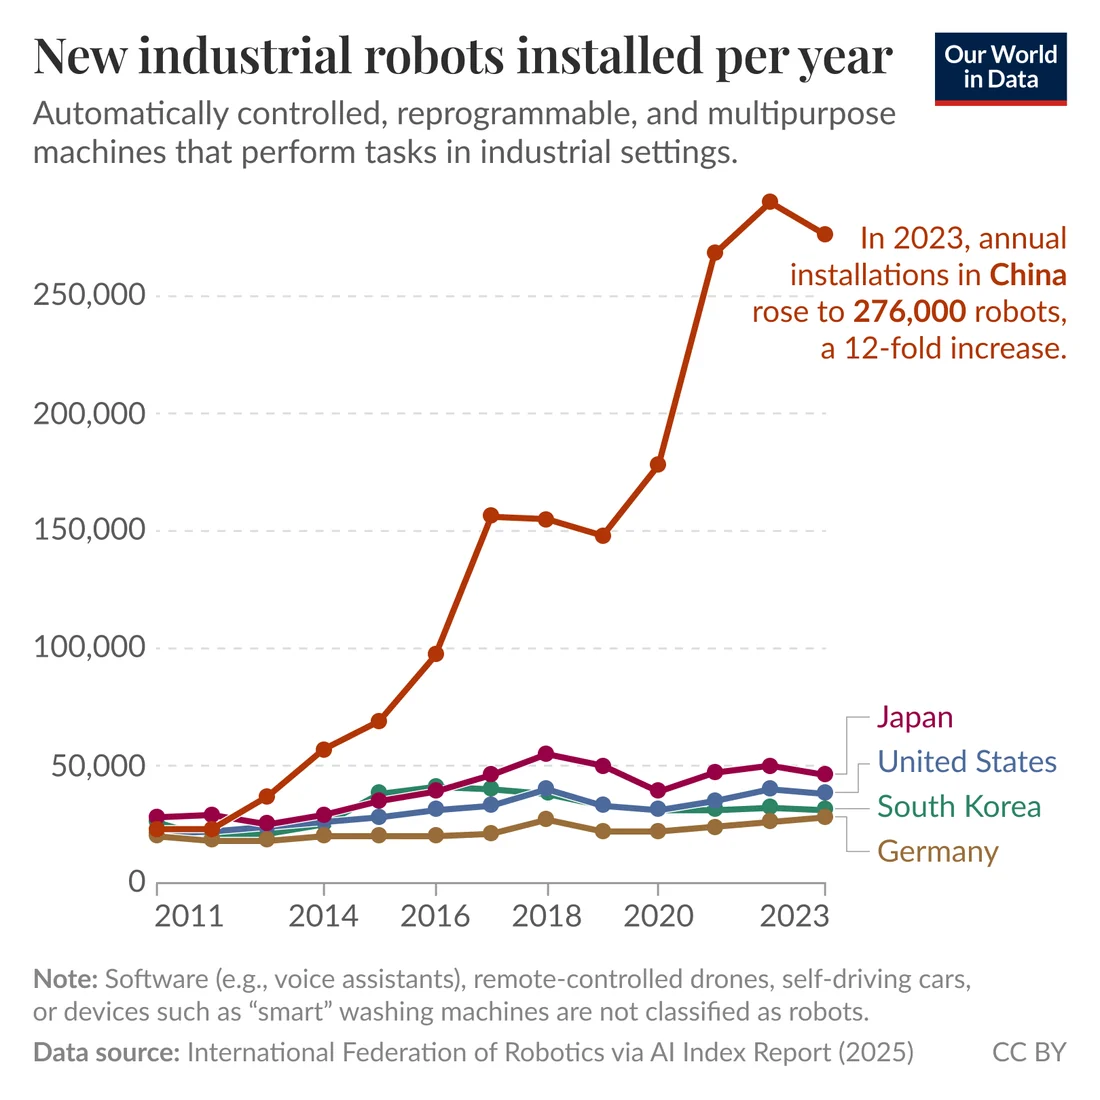
ourworldindata.org · Original source page
Image provenance
Inherited source visual. Image capture date and exact event relationship were not established again in this expansion. Owner publication review pending; credit does not grant permission.
Original assetThe signal
China's factories reached 470 operational industrial robots per 10,000 manufacturing employees in 2023, according to the IFR's density release, up from 402 the year before. The federation states that the increase pushed China into third place worldwide, ahead of Germany's 429 and Japan's 419, within the robotics sector this desk tracks separately from software automation. The world average density stood at 162 robots per 10,000 employees, and the release's own seven-year comparison puts the 2016 global figure at 74, meaning the average has more than doubled since. South Korea's density, at 1,012 per 10,000, is the highest number the release publishes, underlining how much distance separates a handful of dense manufacturing economies from the rest.
The evidence
Density is a ratio, not a headcount: the release defines it as the number of operational industrial robots relative to the number of employees, a figure IFR compiles annually for its World Robotics report from national and corporate installation data submitted to it. That report's overview describes coverage of installations and operational stock back to 1993, spread across roughly 40 country studies. What the material opened for this entry does not specify is whether decommissioned robots are subtracted from the stock count, or how often national employment denominators are refreshed - both matter for a ratio in a way they would not for a simple installation count.
Timeframe and confidence
The finding covers calendar year 2023 and was published in November 2024, part of a series IFR has run since the 1990s, which gives it an unusually long run of comparable figures for this sector. It remains a single measure from a single method: the release does not disclose how sensitive the ranking is to later revisions in either the robot count or the employment base. Reading the increase as evidence of a durable shift in manufacturing structure, rather than one data point that could move on revision, is an editorial extrapolation made explicit here rather than treated as settled.
What would change the reading
A density figure that stalls or falls in the next World Robotics release, or a national statistics agency publishing an employment count that diverges from IFR's denominator, would weaken confidence in the 'third worldwide' framing. Confirmation would come from a second or third consecutive year of increase at a comparable pace, alongside agreement between IFR's country total and an independent employment series for the same year.
- Does the density figure net out retired or decommissioned robots, or only add new installations?
- How has the manufacturing employment denominator moved over the same seven years?
- What tasks do the counted robots perform, and does that mix differ between China, Germany and Japan?
A density ranking measures how concentrated automation is relative to a factory workforce; it says nothing about what the robots installed can do or how well they are deployed. Overtaking two long-established manufacturing economies is a real signal about the pace of adoption, not a verdict on capability.
Source trail
- Global Robot Density in Factories Doubled in Seven Yearsifr.org · Source publication: 2024-11-20 · Retrieved 2026-09-16
States 2023 robot density figures for China (470), Germany (429), Japan (419), South Korea (1,012) and the world average (162), and that China surpassed Germany and Japan that year.
- World Roboticsifr.org · Source publication: not established · Retrieved 2026-09-16
Describes the World Robotics report's scope, its coverage since 1993 and its definition of operational stock and density as the basis for cross-country comparison.
- Event date
- 2024-11-20
- First source date
- 2024-11-20
- Source-record publication
- Not supplied — draft retained
- Preparation
- 2026-09-16