sg.dev.scotsmanguide.com · Original source page
Image provenance
Inherited source visual. Image capture date and exact event relationship were not established again in this expansion. Owner publication review pending; credit does not grant permission.
Original assetThe signal
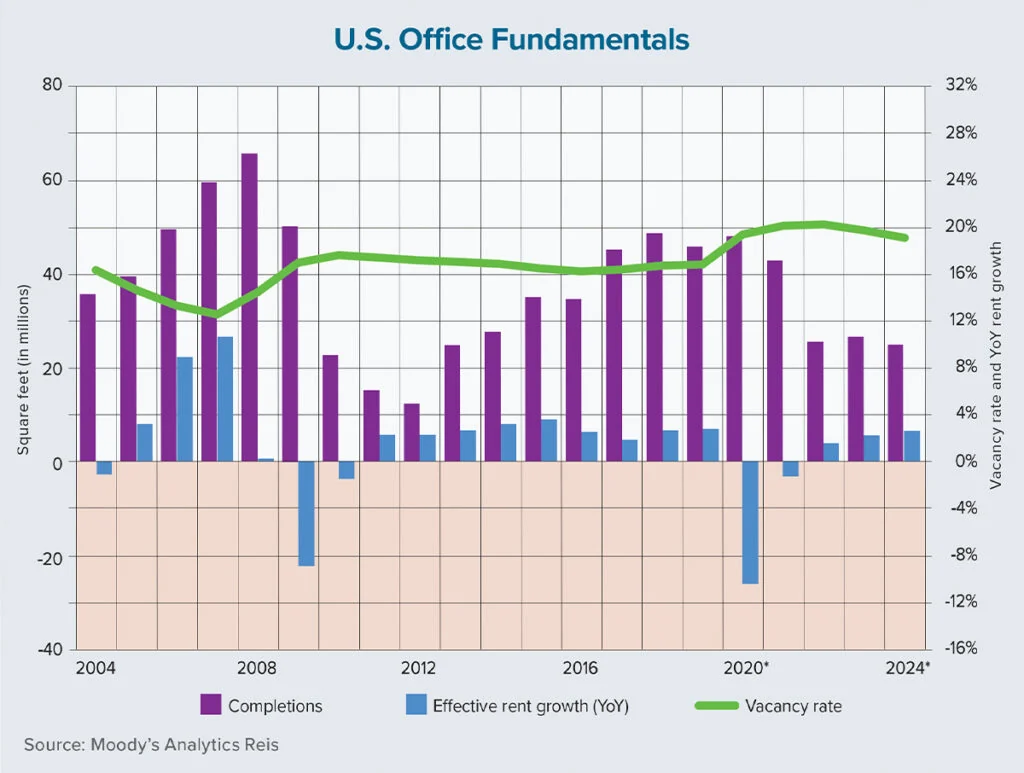
In real estate, CBRE's analysis of office effective rents, published 20 December 2023, states that US office vacancy registered 18.4% in the third quarter of 2023, up from 12.1% in 2019, and that CBRE's own forecast expected vacancy to peak at 19.8% in 2024. The same release ties that vacancy rise to concessions: free-rent periods in top-tier buildings averaged 10.1 months on lease signing that year, up from 6.8 months in 2019, and landlord allowances rose 37% to $98.05 per square foot over the same span. Vacancy, in this series, is the share of leasable office space not currently under lease, a stock measure taken at a point in time rather than a flow of space entering or leaving the market that quarter.
The evidence
A second CBRE release, published 24 June 2024, adds a first-quarter 2024 data point and a distinction the aggregate rate obscures: across 830 buildings CBRE classifies as prime, representing 8% of US office space by square footage, vacancy averaged 14.8% in that quarter, 4.5 percentage points below the rest of the market, up from a 1.9-point gap in mid-2018, while prime buildings commanded an 84% average rent premium, also up from 60% in 2018. From 2020 through the first quarter of 2024, prime buildings logged 48 million square feet of positive net absorption while the rest of the office market lost 170 million square feet. A single national vacancy rate averages across a market that is visibly splitting into two.
Timeframe and confidence
This is an editorial reading: the reported rates are a vendor's tracked series with a published, if not independently audited, methodology, and CBRE's own forecast component of 19.8% for 2024 is explicitly a projection rather than a measurement and should be labelled as such. The bifurcation finding is corroborated by a second, independently dated release six months later, which strengthens confidence in the direction of the trend, even though both figures originate from the same commercial data provider.
What would change the reading
A subsequent CBRE or comparable vendor release confirming vacancy actually reached or exceeded the 19.8% forecast, rather than falling short of it, would validate the projection as measurement rather than overstatement. A narrowing, rather than widening, of the prime-versus-rest vacancy gap in later quarters would suggest the bifurcation was a temporary post-pandemic adjustment rather than a structural repricing of office quality.
- Is a quoted vacancy figure a trailing measurement or a forward-looking forecast, and which quarter does it actually describe?
- Does an office portfolio's performance track the prime cohort or the wider market average, and does that distinction change the investment case?
- What lease-expiration schedule sits behind a given vacancy reading, and how much of any future change is already contracted rather than speculative?
The 2023 vacancy record is a real, dated measurement, but it describes an average across a market CBRE's own later data shows was already dividing into a resilient premium tier and a struggling remainder.
Source trail
- Growth of Office Effective Rents Limited by Record-High Concessionswww.cbre.com · Source publication: 2023-12-20 · Retrieved 2026-09-16
States Q3 2023 vacancy of 18.4%, the 2019 comparison, and CBRE's forecast of a 19.8% peak in 2024.
- CBRE Analysis: Prime Office Buildings Are Dramatically Outplacing the Rest of the Marketwww.cbre.com · Source publication: 2024-06-24 · Retrieved 2026-09-16
Gives Q1 2024 prime-building vacancy, the gap versus the rest of the market, and absorption and rent-premium figures.
- Event date
- 2023-12-20
- First source date
- 2023-12-20
- Source-record publication
- Not supplied — draft retained
- Preparation
- 2026-09-16